


Good monitoring and observability will help you detect problems more quickly when it comes to running production software, spot issues before they become outages, and ultimately save you and your users’ headaches. Both monitoring and observability provide the foundation to improve the customer experience, reduce reliability metrics like Mean Time to Repair (MTTR), and improve Mean Time Between Failures (MTBF).
According to the latest 2022 report, DevOps Research and Assessment (DORA) highlights that good monitoring alongside an observability solution should be prioritized for high-performing and elite teams.
It is important to know the value monitoring can provide and the role it plays in strengthening observability. Read on to learn:
- What is observability and monitoring?
- How are observability and monitoring different?
- Building your monitoring and observability efforts with DataSet
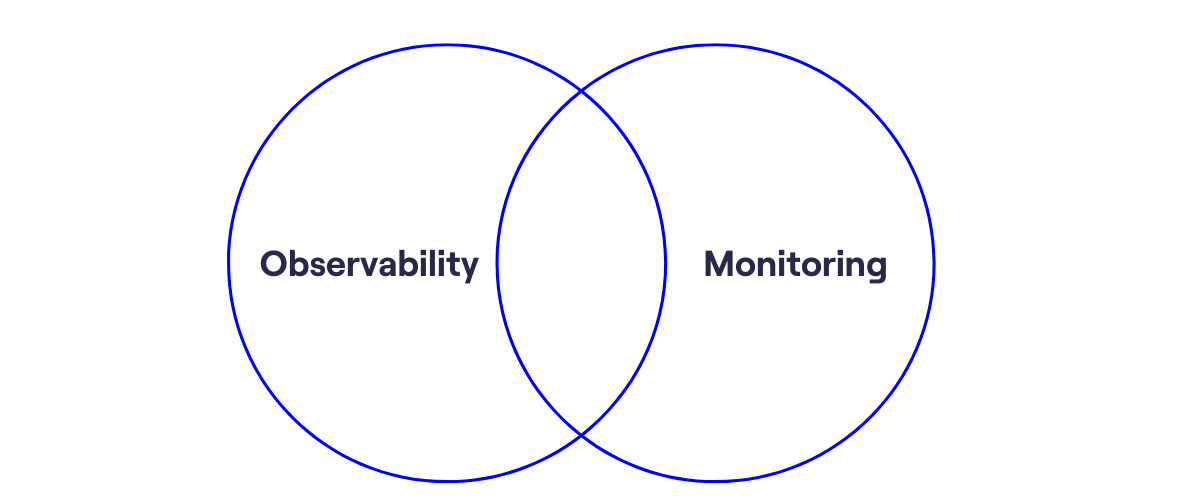
Observability vs. Monitoring
While observability and monitoring sound vaguely similar, they are related but not in the ways you may think. Monitoring helps teams identify problems and receive notifications about them, while observability follows through to aid with problem identification, improving debugging and cause analysis. Additionally, monitoring uses observability tools to track known metrics and failure points while observability provides tools to resolve unknown or unexpected issues. They go hand-in-hand together where you actually need both monitoring and observability if you want to build reliable systems.
Monitoring is tooling or a technical solution that allows teams to watch and understand the state of their systems. Monitoring is based on gathering predefined sets of metrics or logs.
Observability is tooling or a technical solution that allows teams to actively debug their system. Observability is based on exploring properties and patterns not defined in advance.
Observability
With observability, you are able to infer the internal state of a system based on its outputs. Since we cannot predict what we will want to know about our system, we want to track enough data to make sure we can analyze problems from different angles and different aggregates when problems inevitably occur.
There are three main pillars that observability encompasses: metrics, logs, and traces. These three solutions should provide insights into what is going on inside the system.
Metrics
Metrics typically aggregate numeric data about your system and application. For example, you can have metrics around your available CPU and memory and track metrics like response codes, traffic, latency, and errors.
Once system metrics are defined, you can also add on custom metrics that provide relevant business or domain metrics. This allows you to track types of payments, shopping cart size, and a number of abandoned carts, to name a few. For instance with DataSet, you can log simple metrics, or complex multi-field events, with equal ease. Then use your metrics for searching, graphing, alerting, and more.
Metric Types
There are many types of metrics, but the following are the most common:
- Gauge - Gauges represent measurements at a particular point in time. Metrics like CPU, memory, or queue counts use gauges.
- Counter - Counters measure events that occur. For example, you may count the number of requests your API receives, the number of errors that result, or the number of visitors to your application site.
- Histogram - Histograms measure the distributions of events. One of the most common uses for histograms is latency. And instead of using just an average or max, you can determine the 50th, 90th, or 99th percentile of latency that your customers experience.
- Gauge Histogram - As a combination of the gauge and histogram, here you can see the distribution of gauge data. So if we take queue counts as an example gauge, we could plot how long the data has been in the queue with a histogram.
- Info - For information that doesn’t change during a process, you can use info. This can indicate an application version number or dependency version numbers.
With metrics, you have the potential to measure anything that occurs in your system.
Logs
Logs provide textual data regarding events that occur in your system. Some logs can provide the crucial piece of information to resolving issues, but most logs do not add much value, increasing unnecessary noise volume. It is worth aggregating logs because they provide context to recreate and investigate issues, but it can also be a nuance to reduce log clutter.
It is important to consider leveraging log analytics tools that can help scale data without slowing performance. If you would like to avoid having to query different sources of information when troubleshooting, you want to have your database logs in the same location as your application logs. In other words, you need to have centralized logging, which is provided by solutions like DataSet. Instantly aggregate, search and analyze log data across the entire stack. No matter where an anomaly occurs, you can detect, triage, root cause and resolve.
Traces
Both logs and metrics can relate to particular events that occur within the system, but they do not provide the ability to trace one particular transaction or customer until we add tracing.
For example, if you want to follow a customer’s experience for a particular transaction that failed, you can look at traces and tie relevant metrics, errors, and logs together to show the path through the code that a particular transaction took. With traces, we gain the ability to trace one process, transaction, or experience through our system.
 Pitfalls: Three Pillars
Businesses should take some caution when determining whether observability is the solution to their problems. Many wrongfully assume that if they have monitoring, logging, and traceability, they have observability. But that’s not always the case.
In fact, common pitfalls can add more pain and make debugging more complex. For example, if you have three disparate systems that provide the logging, metrics, and traces, your engineers will have to context switch and attempt to correlate the data in those systems themselves. That can lead to errors, a longer time to debug, and frustration.
Additionally, some companies have the “silver bullet” pitfall. Observability isn’t just about throwing a tool or dashboards at your application teams. It is also about building a solid foundation of good logging and metric fundamentals.
Even if teams have all the tools at their disposal, if their application reliability and availability aren’t improving, there may not be any observability, no matter how many fancy dashboards you may have.
Monitoring
Now that we have a good understanding of observability, what about monitoring? With monitoring, we use some of our observability tools to identify issues, notify the software team of those issues, and even predict potential trends in our system’s reliability.
Dashboard monitoring becomes important when tracking metrics and logs, but it should incite actionable steps. Automated alerts should be set up to provide notifications when things need to be looked at or when systems experience issues – and the dashboards should provide relevant data for investigative purposes. DataSet unifies multiple functions into a single tool: log aggregation, search, and analysis; server metrics; dashboards and alerts, external monitoring, and more. At the heart of all this is the event database, a universal repository for logs, metrics, and other operational data, hosted on our servers.
Now this doesn’t mean that you always need an incident to review dashboards. You can also explore the current health of the system or the activities taking place. Then you can start to see how different types of traffic or load affect other parts of the system. From there, you can start to predict when issues may crop up in the future.
Reaching Observability with Centralized Logging
Observability and monitoring go hand in hand. Dedicate the time to understand your system and its architecture and components to know where reliability is lacking within. You can use tools like DataSet to start aggregating your system’s logs in a centralized location and troubleshoot in a better way.
Thousands of Zalando engineers use DataSet for application observability to proactively monitor their end-to-end system health, detect potential problems before they arise, and quickly troubleshoot incidents.
How can you get started? Start a free trial with DataSet and see how you can combine observability and monitoring to ensure your teams can not only detect issues but also resolve them quickly:
- Free for 30-days
- All features enabled
- Unlimited Users, Queries, Dashboards, Real-time alerts
- No credit card required
- Scale to petabytes of data
