


When I left Google with the idea for a new kind of server monitoring tool, the idea was to combine traditionally separate functions such as log exploration, log aggregation and analysis, metrics gathering, alerting, and dashboard generation into a single service. One tenet was that the service should be fast, giving ops teams a lightweight, interactive, “fun” experience. This would require analyzing multi-gigabyte data sets at subsecond speeds, and doing it on a budget. Existing log management tools were often slow and clunky, so we were facing a challenge, but the good kind — an opportunity to deliver a new user experience through solid engineering.
I’ll be sharing how we met that challenge using an “old school”, brute-force approach, by eliminating layers and avoiding complex data structures. Here are lessons that you can apply to your own engineering challenges.
The power of the old ways.
Log exploration generally starts with a search step — find all messages matching some pattern. At DataSet, this might involve tens or hundreds of gigabytes of logs, collected from many servers. Modern approaches to this kind of problem generally involve building some sort of complex, search-optimized data structure. I’d certainly seen this at Google, where they’re pretty good at that kind of thing. But at DataSet, we settled on a much more brute-force approach: a linear scan through the log. And it worked — we’re able to provide a rich, exploratory experience at speeds that put competing products to shame.
The key insight is that modern processors are really fast at simple, straight-line operations. It’s easy to lose track of that, in the complex, deeply-layered, I/O and network-dependent systems that are so common nowadays. So we put together a system design that minimizes layering and cruft. By harnessing multiple processors and servers in parallel, we’re able to achieve search speeds of Terabytes in seconds — that’s Terabytes not Gigabytes — in real use.
Key points to take away from this article:
- Brute force is a viable approach to real-world, large-scale problems.
- Brute force is an engineering technique, not a get-out-of-work-free card. Like any technique, it is better suited to some problems than others, and can be applied poorly or well.
- Brute force is particularly good at delivering consistent performance.
- Effective use of brute force requires streamlining your code, and being able to bring sufficient force to bear in a timely fashion. If your servers have a heavy non-user-facing workload, and you can allow user-facing operations to take priority, that’s an opportunity. We aim to use every core and spindle we own in service of every user request.
- Performance, as perceived by the user, is a function of your entire system design, not just your inner-loop algorithm.
Most of the time, when a user performs a log search, the DataSet servers already have the relevant logs cached in memory.
Choosing brute force.
Traditionally, searching a large data set is done with a keyword index. Applied to server logs, this would mean finding each unique word that appears in the log. For each word, we would make a list of all log messages containing that word. This makes it easy to find all messages containing a single word, like “error” or “firefox” or “transaction_16851951” — just read off the list for that word.
I used this technique on projects at Google, and it worked well. But at DataSet, when a user asks us to search their logs, we search their logs, byte by byte.
Why do it this way? From an abstract algorithmic perspective, keyword indexes can be far more efficient than brute search. However, we don’t sell algorithms, we sell performance. And performance is not merely an algorithms question, it’s a systems engineering question. We have to consider everything: how much data is being searched, what types of searches users perform, the available hardware, and the software context in which the search will occur. For our particular problem, we decided that something more like “grep” would work better than a keyword index.
Keyword indexes are great, but they have limitations. Searching for a single word is easy. Searching for multiple words — messages containing both “googlebot” and “404” — is not much harder. Searching for a phrase, like “uncaught exception”, gets a bit trickier, requiring a slightly bulkier index that not only tracks which messages contain a word, but where in the message the word appears.
The real difficulty arises when your search isn’t about words. Suppose you want to see how much of your web traffic comes from bots. As a quick hack, you might search your access logs for “bot” — this won’t catch everything, but it will match Googlebot, Bingbot, and plenty of others. However, “bot” in this context isn’t a word, it’s a word fragment. If we look up the word “bot” in our keyword index, we won’t find messages with the word “Googlebot”. It’s possible to find all instances of “bot” with a keyword index, but it can be very slow: we’d have to check every word in the index to see which words have “bot” as a fragment, and then scan the index for every one of those words. As a result, some log managers don’t allow searching for partial words, or (at best) allow it using special syntax and with slower performance. We don’t want to be that kind of tool.
Punctuation is another challenge. Want to find all requests from 50.168.29.7? How about debugging logs that contain [error]? Keyword indexes usually omit punctuation.
Finally, engineers like powerful tools, and sometimes nothing will do but a regular expression. Using a keyword index for regular expressions is difficult at best.
Capabilities aside, keyword indexes are complex. Each message has to be added to multiple keyword lists. These lists constantly have to be collated and maintained in seek-friendly form on disk. Queries that involve phrases, word fragments, or regular expressions have to be translated into operations on multiple keyword lists, and the resulting lists have to be scanned and merged to yield a result set. This complexity, in the context of a large-scale, multi-tenant service, can create performance problems that don’t show up in an algorithm analysis.
Keyword indexes also use a significant amount of storage, and storage can be a major cost driver for log management.
On the flip side, we can afford to devote a lot of processing power to each search. Our users value the high-speed, ad-hoc log exploration we provide, but ad-hoc exploration is not something they do constantly. We use some special tricks for searches that are executed frequently, e.g. as part of a dashboard. (We’ll describe this in a future article.) The remaining searches are infrequent enough that, across our entire service, we’re rarely processing more than one at a time. But that doesn’t mean our servers aren’t busy: they have a heavy workload ingesting, parsing, and compressing new log messages, evaluating alerts, compacting older data, and so forth. So we have a fairly substantial investment in CPUs, which we can leverage for query execution. (I’ll say more about that later on.)
Brute force works if you have a brute problem (and a lot of force).
Brute force works best on simple tasks with small inner loops. Often, you can optimize the inner loop to run at very high speeds. If your code is complex, extreme optimization is much more difficult.
Originally, the inner loop of our search code was fairly large. We store log messages in pages of 4K; each page contains some messages (in UTF-8), and some metadata for each message. The metadata is a byte-packed structure which encodes the value length, internal message ID, and various other fields. The search loop looked like this:
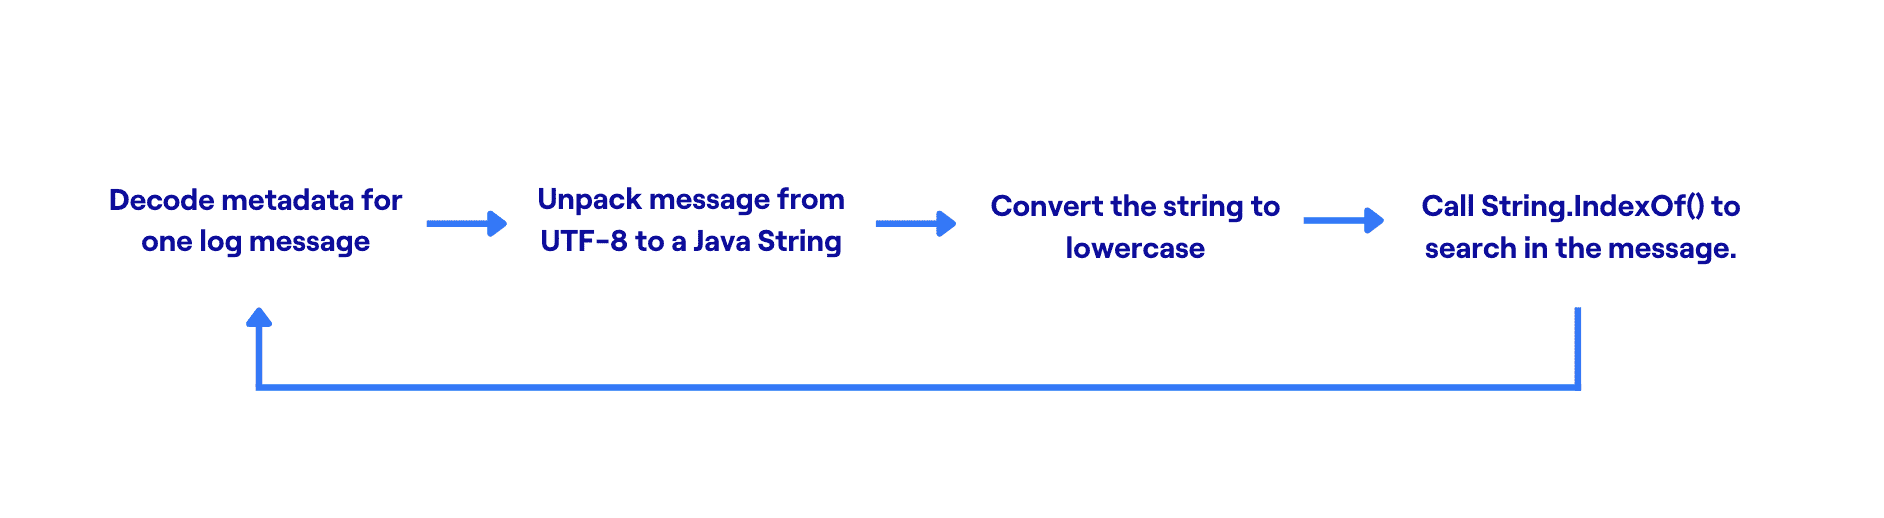
This is simplified from the actual code. Even so, it involves multiple object allocations, data copies, and function calls. The JVM is quite good at optimizing function calls and allocating ephemeral objects, so this code worked better than we probably deserved. Our pilot customers used it quite happily. But eventually we outgrew it.
You might wonder why we store log messages in this 4K-paged, metadata-and-text format, rather than working with raw log files directly. There are many reasons, which boil down to the fact that internally, the DataSet log engine looks more like a distributed database than a file system. Text searches are often combined with database-style filters on parsed log fields; we may be searching many thousands of logs at once; and simple text files are not a good fit for our transactional, replicated, distributed data management.
In its original form, this code was not a good candidate for brute-force optimization. The “real work”, in String.indexOf(), wasn’t even the dominant portion of the CPU profile. No amount of optimization of that method alone would have had a significant effect.
It so happens that in each 4K page, we store metadata at the beginning of the page, and then the UTF-8 text of all the log messages packed together at the other end. Taking advantage of this, we rewrote the search loop to search an entire page at a time:
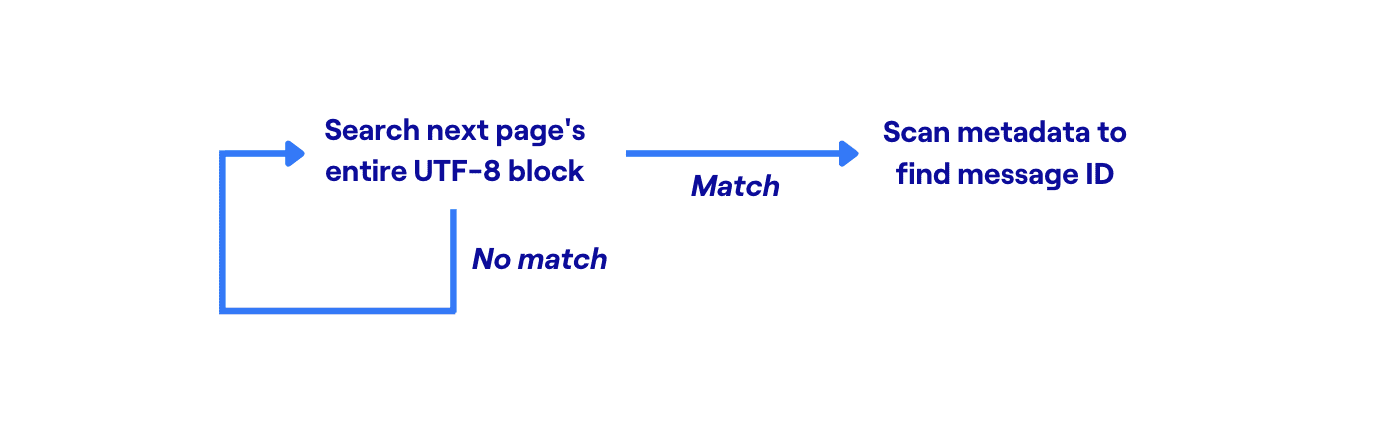
This version works directly on the raw byte[] representation, and searches all the messages in an entire 4K page at once.
This is a much better candidate for brute-force optimization. Our inner search loop is invoked for 4K of data at a time, instead of being called separately for each message. There is no data copying or object allocation. And the more complex metadata operations are invoked only once per match, rather than once per log message. So we eliminated a ton of overhead, and the remaining work is focused in a small inner search loop which is a good candidate for further optimization.
The actual search algorithm we use is based on a nice idea presented by Leonid Volnitsky. It’s similar to Boyer-Moore search, skipping ahead by roughly the length of the search string at each step. The chief difference is that it examines two bytes at a time, to minimize false matches.
Our implementation requires building a 64K lookup table for each search, but that’s cheap compared to the gigabytes of data we’re searching. The inner loop is capable of searching multiple gigabytes per second on a single core. We have some remaining non-inner-loop overhead to eliminate, and we plan to experiment with moving the inner loop from Java to C.
Bringing force to bear.
We’ve discussed how log search can be implemented as a “brute” problem. How much “force” can we harness? Quite a lot.
1 core: A single modern CPU core, properly used, is quite powerful on its own.
8 cores: We’re currently using AWS SSD-based servers, each of which has 8 cores (16 with hyperthreading). Normally, these cores are busy handling background operations, as mentioned above. When a user performs a search, we pause all background operations, freeing all 8 cores for the search. The search usually completes in a fraction of a second, after which background work resumes. (A governor ensures that a flurry of searches won’t starve important background work.)
16 cores: For reliability, we organize our servers into master / slave groups. Each master has one SSD-based slave, and one EBS-based slave. If a master server fails, the SSD-based slave can immediately take its place. Almost all of the time, the master and slave are both healthy, meaning that each data block is available for searching on two different servers. (The EBS slave has minimal CPU, so we don’t consider it here.) We assign half of each search to the slave, meaning that we have a total of 16 CPU cores to use.
Many cores: In the near future, we’ll be spreading data across servers in such a way that all of our servers can participate in every non-trivial query. In this way, every core we own comes into play. When combined with high per-core search performance, we have achieved aggregate search performance of Terabytes/second and beyond.
Simple is reliable.
Another benefit of a simple, brute-force solution is that the performance it provides is fairly consistent. Brute force tends to not be overly sensitive to details of the task and data set. (I guess that’s why they call it “brute”.)
A keyword index can deliver blazingly fast results in some cases, but might not in others. Suppose you have 50GB of logs, in which the term “customer_5987235982” appears exactly three times. A search for “customer_5987235982” would read the locations of the three matches directly from the index for that term, and complete instantaneously. But a complex wildcard search might scan thousands of keywords, and take a long time to complete.
Brute-force search, on the other hand, will run at more or less the same speed for any query. Long search terms perform better, but even searching for a single character is reasonably fast.
Algorithmic complexity aside, the simplicity of brute-force search means that observed performance will come closer to theoretical performance. There is less scope for unanticipated disk thrashing, lock contention, uncached pointer chasing, and all the thousand natural shocks that code is heir to.
Consistent, reliable performance is an important part of user experience. If a service is intermittently slow, users will perceive it as flaky, and be reluctant to use it.
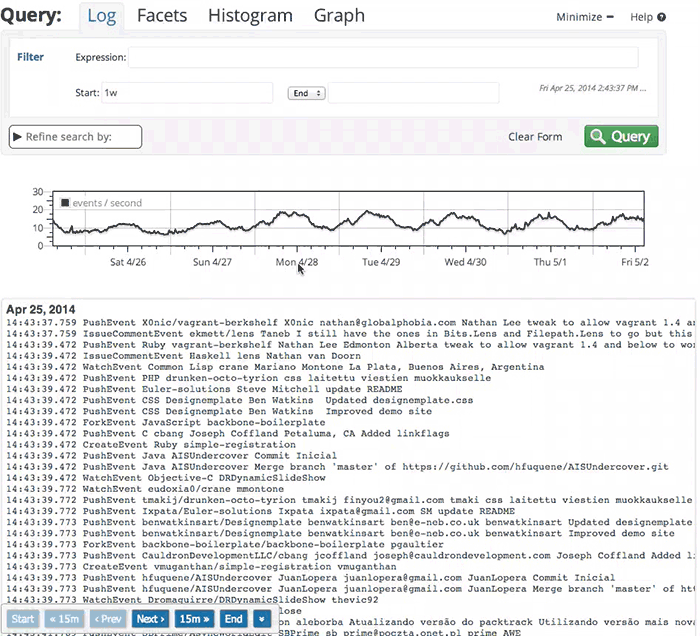
See the log search in action.
Here’s a brief video clip, illustrating DataSet log exploration in action. We have a demo account into which we import every event on every public Github repository. In one of my past demos, I’m exploring around 600MB of raw log data.
This was recorded live, with no special preparation, on my desktop (about 3000 miles from the server). The performance you’ll see owes much to the work we’ve done on our web client, but also to the fast, reliable backend. Whenever you see a pause with no “loading” indicator, that’s me pausing to give you a chance to read whatever I’m about to click on.
In conclusion,
When processing large amounts of data, it’s important to choose a good algorithm, but “good” does not always mean “fancy”. It’s important to think about how your code will perform in practice. Constant factors drop out of “Big O” analysis, but they can be large enough to matter in the real world. Simpler algorithms are easier to optimize, and less vulnerable to bad edge-case behavior.
Also think about the context in which your code will run. In our case, we need fairly powerful servers to manage background tasks. User-initiated searches are relatively infrequent, so we can commandeer an entire group of servers for the brief period needed to execute each search.
This is part of a series of posts on systems engineering and performance at DataSet.
Using a brute-force approach, we’ve been able to implement blazing-fast, reliable, flexible search of aggregated logs. We hope you’ll find these ideas useful in your own projects. If you’d like to see DataSet performance in action, try it free or learn more about our platform. Also: DataSet is hiring! If you like working on this kind of system, then please stop by: www.sentinelone.com/careers/.
